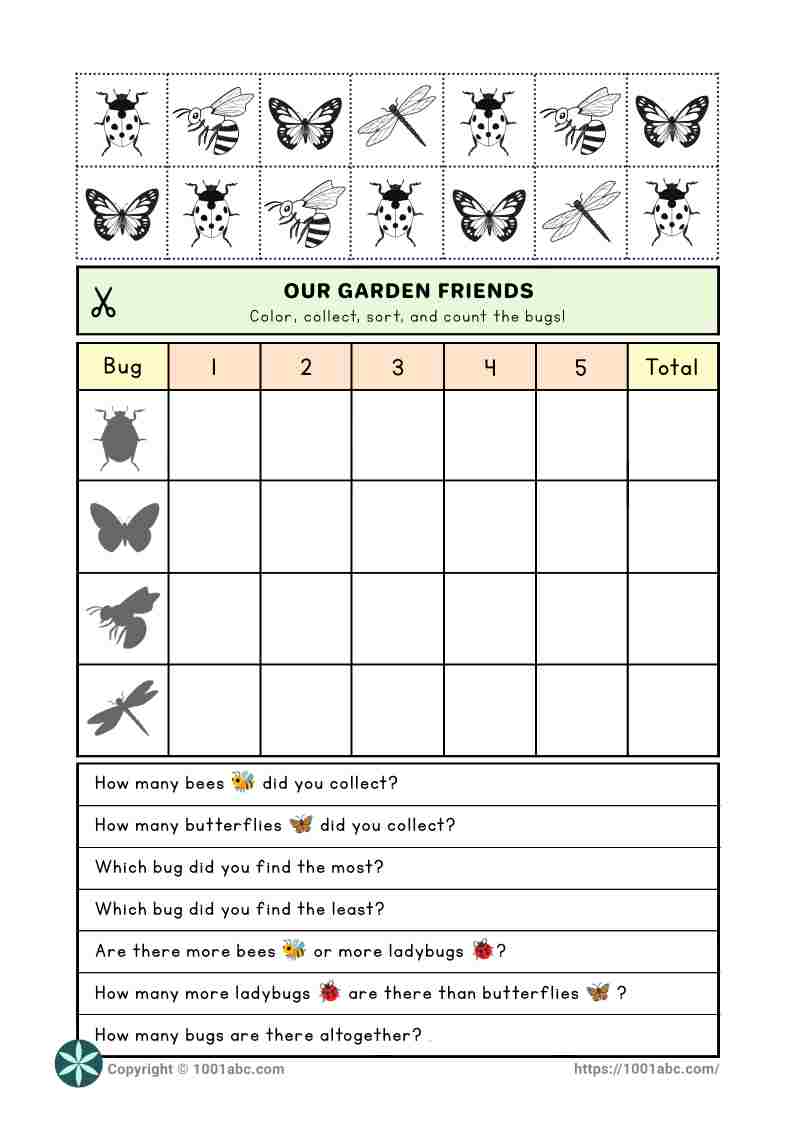
Description
At the ages of 5 to 8, children are transitioning from sensorimotor-based learning (hands-on experiences) to representational thought (pictures and symbols). By cutting, sorting, and placing each bug into a pictograph, children learn that a symbol on a page can represent real-world objects. This process builds a foundation for counting, comparing quantities, and interpreting data.
Based on Jean Piaget’s Cognitive Development Theory, this worksheet specifically supports children in the preoperational stage as they move toward the concrete operational stage. Children begin to understand classification (identifying and grouping objects), conservation of numbers (realizing that the quantity of bugs remains the same whether they are jumbled or neatly organized), and the process of adaptation as they transform jumbled data into a clear, organized format.
The activity also reflects Jerome Bruner’s three modes of representation. Children participate in the three core stages of learning:
- Enactive stage (action-based): learning by doing through physically interact with the data as they “collecting” (cutting) and pasting the 14 bug tiles.
- Iconic stage (visual-based): learning through pictures and symbols, by placing the pictures into the grid and observing how the physical length of each row represents quantity.
- Symbolic stage (abstract-based): translating visual representations into numerical symbols and mathematical language.
By integrating fine motor skills through collect and organize the bug pictures before answering questions, this activity also supports conceptual understanding. The numbered horizontal pictograph (1–5) acts as “mathematical scaffolding”, helping children bridge the gap between one-one correspondences (counting each bug individually) and cardinality principle (understanding the final number represents the total quantity).
Task Overview
To guide children through the journey from “messy data” to “clear answers”, the worksheet is divided into three key zones:
- The observation zone: A jumbled “garden” of 14 bugs. Children must identify and color the four different bug types, practicing visual discrimination.
- The data interpretation zone: A horizontal pictograph grid where children sort and paste their “collected” tiles (1 square = 1 bug). This process transforms the “messy” collection into a clear, visual representation.
- The analysis zone: A series of scaffolded questions, from simple counting to higher-level comparison and synthesis. This final stage ensures they aren’t just counting, but truly interpreting what the data is telling them.
Instruction
- Color all the bug pictures.
- Carefully cut out each bug picture.
- Look at the pictograph table.
- Paste each bug into the correct row based on its type.
- Count how many bugs are in each group.
- Write the total number in the “Total” column.
- Answer all the questions below the pictograph.
Skill Practiced
This activity supports the development of several skills:
- Fine motor: cutting and gluing to build hand strength.
- Visual discrimination: spotting differences between bug shapes.
- Data literacy: learning to read and interpret charts.
- Math vocabulary: using comparison words like most, least, more than, and altogether.
- Logical thinking: grouping items and comparing quantities.
- Critical thinking: solving problems using the graph.
- Early math: practicing counting, one-to-one correspondence, and cardinality principle.
Download: Pictograph – cut and paste – insects (PDF)
Find similar worksheets: Educational Worksheets.
***
Related posts:
Explore:
***
Please visit Free Printable, to get more coloring pages and worksheets for kids.